- גרסה: V1.1.12
- גודל הורדה: 16.85 MB
- שוחרר בתאריך: 05-10-2017
- מערכת הפעלה: iOS 9.0 ומעלה
- תאימות:
- מתאים עבור: גילאי 12 ומעלה
- מחיר בחנות: ₪ 6.90
שתפו אפליקציה זו עם החברים
* NOAA Hurricane Tracking & Forecast Data *
MAIN FEATURES INCLUDE:
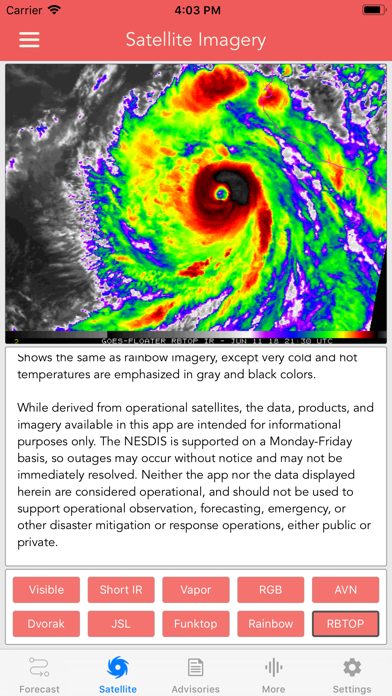
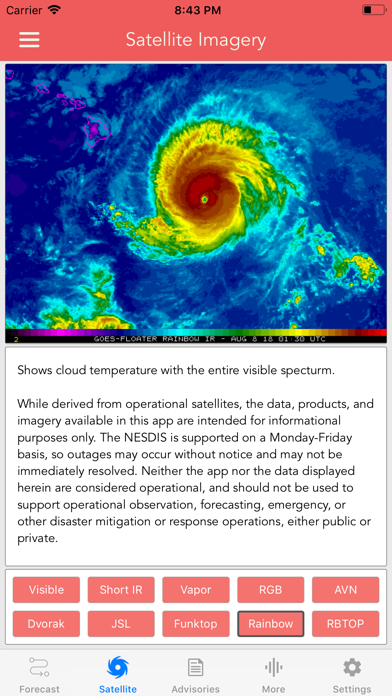
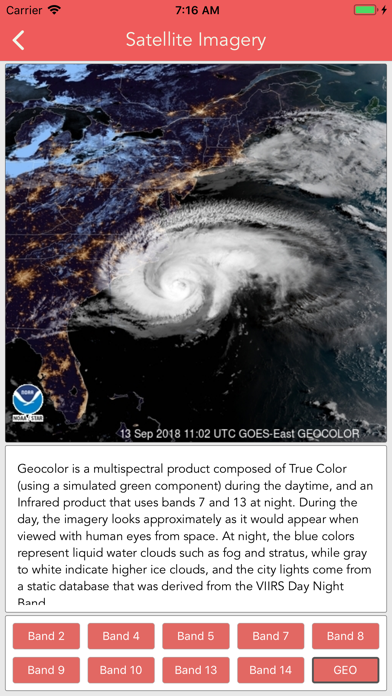
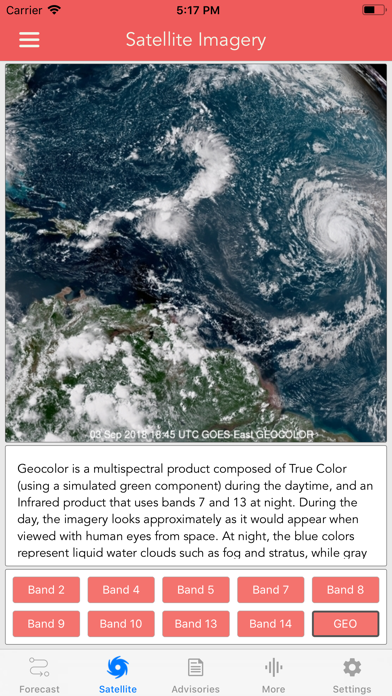
* GOES Satellite Imagery Animations
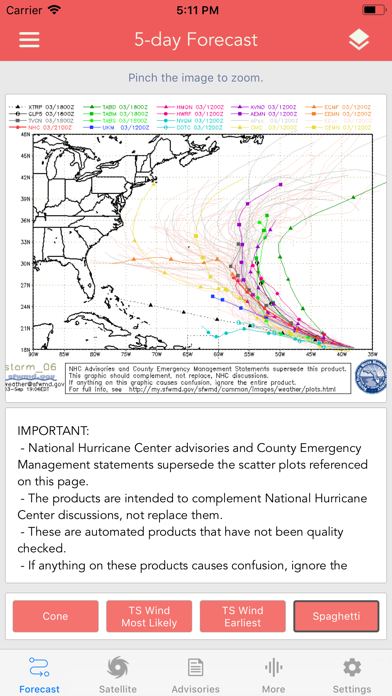
* Spaghetti Models!
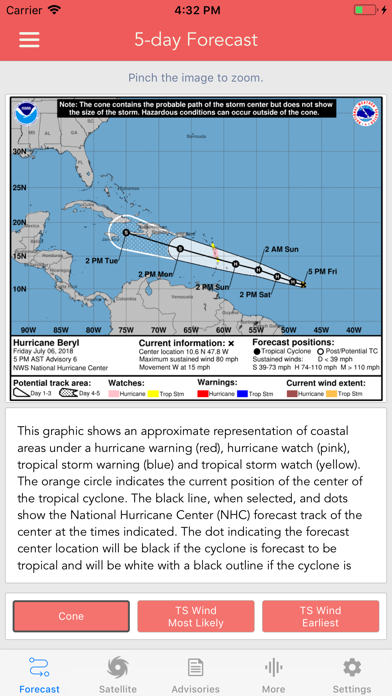
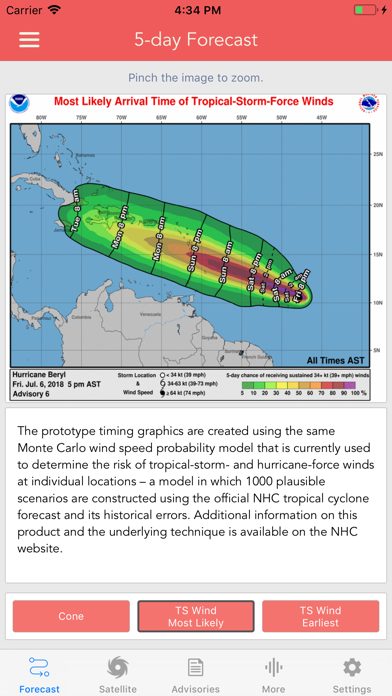
* 5-day Hurricane Forecast / Tracker
* 5-day Tropical Storm Outlook (Pacific)
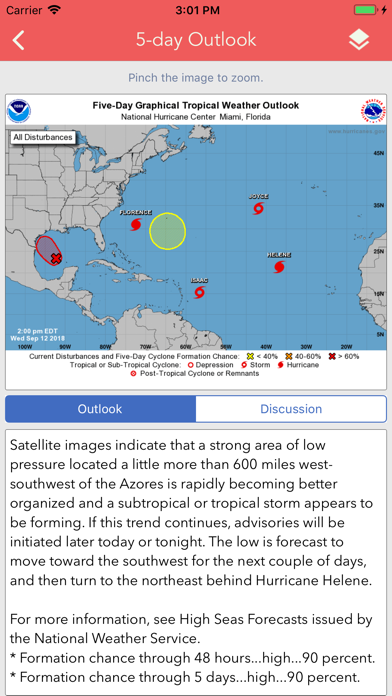
* 5-day Tropical Storm Outlook (Atlantic)
* 5-day Tropical Storm Outlook (Central Pacific)
* 2-week Tropical Storm Outlook (Global)
* NWS Tropical Weather Discussion
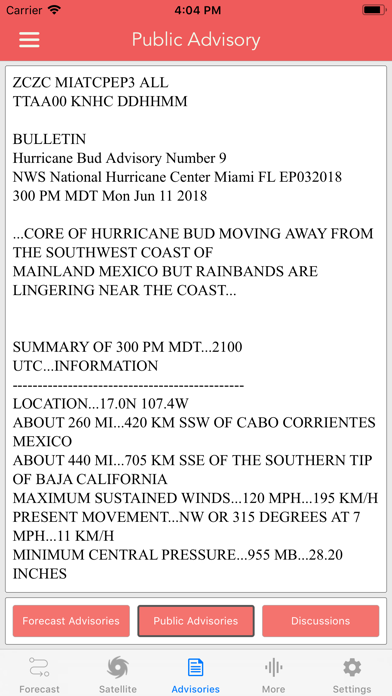
* Storm Specific Forecast & Public Advisories
* New Storm Push Notifications
* Dvorak Storm Intensity Index
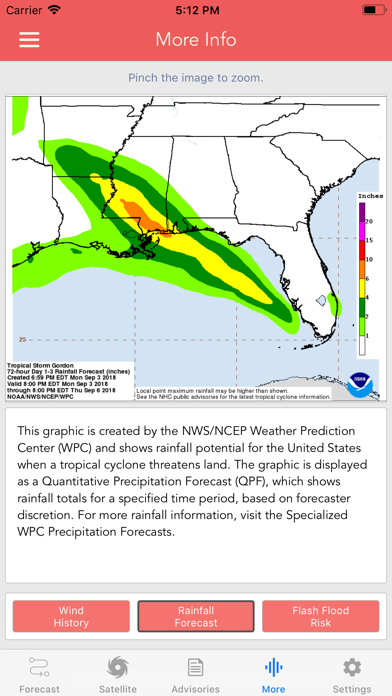
* Wind History, Rainfall Forecast & Flash Flood Risk Graphics
* Local storm threat graphics
By far the fastest, most convenient way to access National Hurricane Center data. The app displays detailed satellite imagery animations, allowing you to track the storm using the most recent observations.
More satellite animation filter details below:
-- Band 2 --
0.64 µm - 'Red' Band - 0.5 km resolution - Visible band 2 is in the red portion of the spectrum and has the highest resolution of any ABI band at 0.5 km, and for that reason is the primary visible band. It is used primarily to monitor the evolution of clouds throughout the daylight hours.
-- Band 4 --
1.37 µm - 'Cirrus' Band - 2 km resolution - Band 4 will detect very thin cirrus clouds during the day. This band is centered in a strong water vapor absorption spectral region. It does not routinely sense the lower troposphere, where there is substantial water vapor, and thus provides excellent daytime sensitivity to high, very thin cirrus under most circumstances.
-- Band 5 --
1.6 µm - 'Snow/Ice' Band - 1 km resolution - During the day band 5 can be used to differentiate ice clouds and snow (relatively dark) from liquid water clouds (relatively bright), such as fog and stratus.
-- Band 7 --
3.9 µm - 'Shortwave Window' Band - 2 km resolution - Band 7 has a variety of applications, including fire detection, cloud particle size retrievals, and differentiating between liquid water and ice clouds. Fire hot spots will show up as relatively small dark gray to black pixels. GOES-16 band 7 corresponds approximately to the old GOES-13 infrared channel.
-- Band 8 / 9 / 10 --
6.2 µm - 'Water Vapor' Bands - Band 8 will be used for upper-level tropospheric water vapor tracking, jet stream identification, hurricane track forecasting, mid-latitude storm forecasting, severe weather analysis, upper mid-level moisture estimation (for legacy vertical moisture profiles) and turbulence detection. The imager on GOES-16 features three mid-level water vapor bands instead of the single water vapor band on the GOES-13 Imager. The single water vapor band on GOES-13 contained a mixture of water vapor features over many levels of the troposphere, but GOES-16 enables us to focus on water vapor in the upper troposphere (band 8), the middle troposphere (band 9), or the lower troposphere (band 10).
-- Band 13 --
10.3 µm - 'Clean' Longwave IR Window Band - Band 13 at 10.3 µm is an infrared window, meaning it is not strongly affected by atmospheric water vapor. This channel is useful for detecting clouds all times of day and night and is particularly useful in retrievals of cloud top height.
-- Band 14 --
11.2 µm - IR Longwave Window Band - the traditional longwave infrared window band, is used to diagnose discrete clouds and organized features for general weather forecasting, analysis, and broadcasting applications. Observations from this IR window channel characterize atmospheric processes associated with extratropical cyclones and also in single thunderstorms and convective complexes.
-- GEOCOLOR Band --
Geocolor is a multispectral product composed of True Color during the daytime, and an Infrared product that uses bands 7 and 13 at night. During the day, the imagery looks approximately as it would appear when viewed with human eyes from space. At night, the blue colors represent liquid water clouds such as fog and stratus, while gray to white indicate higher ice clouds, and the city lights come from a static database.
הורידו עכשיו את National Hurricane Center Data, אפליקציה שפותחה במיוחד עבור אייפון ואייפד ע"י LW Brands, LLC. נשמח לשמוע מכם תגובות, שתפו אותנו בחווית השימוש, שאלות או טיפים שימושיים על National Hurricane Center Data.
צריכים עזרה? נשמח לעזור לכם להשתמש באפליקציית National Hurricane Center Data באמצעות מדריכי וידאו, עזרה, טריקים ועוד.